TransLink’s 2024 stats show huge growth where service is increased and huge declines where service is cut.If true, this means transit investments can reduce congestion and boost affordability almost immediately.
When you’re done with this, click here to read our more detailed analysis.
Today, TransLink has released its annual Transit Service Performance Review, which provides detailed statistics on transit usage in 2024. It tells two starkly different stories in Vancouver versus South of the Fraser, but they are united by the same phenomenon:
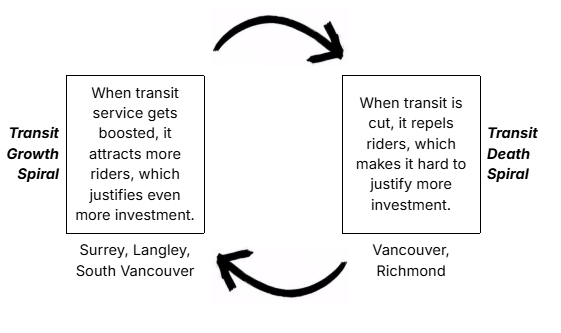
Since the start of the pandemic, TransLink has not had the funding to increase bus service at all, but the region’s population has grown by 13%. Early in the pandemic, transit ridership growth and overcrowding became the most acute in areas where rent was generally more affordable, as essential workers continued relying on transit.
Without additional funding, TransLink responded to this growth by cutting service in areas that had seen ridership drop, and shifting that service to the overcrowded areas. But over time, it appears that these changes may have become self perpetuating.
A tale of two routes: the 8 and the 323
If you’re a regular transit user in the Newton neighbourhood of Surrey, your transit wait times have gone down significantly since 2020. The 323, on 128 St, comes every 6 minutes now, using a 120-passenger articulated bus. Compare with 2019 when the wait for a bus was 15 minutes, and the bus only held 80 people. Note that there has not been significant new housing construction in this area. We suspect that with the boosted transit service, it has become one of the best places to live in the region if you are looking for a combination of affordable housing and frequent transit. As a result, 2024 ridership on the 323 is up 62% over 2019, and despite the boosted service, the 323 remains the 17th most overcrowded route in the region.
The story is different if you’re a user of the 8 bus on Fraser Street in Vancouver. It has seen the starkest ridership drop of any corridor in the region, currently at 47% of 2019 levels. In 2019, the wait for a bus was as low as 6 minutes, whereas today, the most frequent service is 15 minutes. Similar to the previous example, there has not been any significant change in the physical neighbourhood. The increase in people who are working from home likely plays a role in this higher-cost neighbourhood, but remote work policies have fluctuated a lot between 2022 and 2024, while ridership has remained closely correlated with service levels over those three years.
A rising tide lifts all ships
The effects of these spirals extend beyond individual routes, because transit is a network. Your route becomes more useful when connecting routes become more frequent, and this is part of the explanation for the stampede towards transit in Surrey.
The 21% increase in ridership on Scott Road in a single year as a result of the new R6 RapidBus is exciting and welcome. The boost in capacity, reliability and speed have clearly been noticed by riders.
But far more interesting and jaw-dropping are a roughly 20% increase on five other routes in Surrey that have not seen the launch of a flashy new RapidBus. This is the network effect in action, as “a rising tide lifts all ships”:
2024’s Fastest growing routes in Metro Vancouver
Routes under 500,000 annual boardings excluded
- 326 (88 Ave and 156 St, Surrey) – 22.1%
- 321 (King George Blvd, Surrey) – 21.5%
- 373 (Bolivar Heights, Surrey) – 19.3%
- 322 (South Newton and Panorama Ridge, Surrey) – 18.7%
- 323 (128 Street, Surrey) – 18.3%
Transit shortages cause traffic & hold people back from opportunity
This report offers the evidence needed for pro-transit Mayors and MLAs, especially in Vancouver, Surrey, and Langley, to keep pushing for transit service increases in their cities. If transit ridership responds so quickly to changes in service levels, it raises the question: What are peoples’ alternatives? It’s likely that many people are driving if their transit is insufficient, while others may not be able to drive, if they can’t afford a vehicle or if they have a disability.
This means that increased bus service has the potential to rapidly reduce traffic congestion, and to rapidly increase freedom of mobility for people that can’t drive.
- In Vancouver, how many cars are on the road because transit frequency has dropped to historic lows on streets like Commercial Dr, Fraser St, and Main St?
- In Surrey and Langley, how many people can’t get to work on time because “SORRY BUS FULL” is still a common experience on 128 St, King George Blvd, and 152 St?
Little progress on bus speed improvements
Some efforts to improve speed and reliability have been successful. The City of North Vancouver’s new eastbound bus lane on Main St. has boosted the R2’s speed by 2.5%, and that’s likely partial data as the lane opened part way through the year.
Meanwhile, many of the busiest routes in Surrey saw big drops in speed, likely due to a combination of increased congestion and increased ridership. When more people use a bus, it takes longer to load and unload them at bus stops. Other cities allow riders to board at all doors, which significantly speeds things up, and we encourage TransLink to take that step here.
The slowest five routes remain in Vancouver, with the slowest being the 5/6, serving the West End at an average speed of 9.8 km/h. We continue to encourage cities across the region to enact fast and low-cost bus speed measures, like we had during the 2010 Olympics. Toronto recently implemented a bus lane 4 days after a council motion.
Other key takeaways:
- Transit ridership is still hovering at around 90% of 2019 levels overall
- Surrey Central is now in the top 5 SkyTrain stations
- Articulated buses have seriously reduced overcrowding on the 2 and 25, but these larger buses have been paired with a reduction in frequency, which risks reducing transit use.
- Ridership in Surrey is increasing very quickly, but Vancouver is still first in total boardings by a wide margin.
If you can’t get enough TSPR analysis, read our more detailed review.