
TransLink’s 2025 stats show that while systemwide ridership declined, routes with service increases remained resilient.
For Immediate Release
August 7th, 2026 (revised August 13, 2026)
TransLink released its annual Transit Service Performance Review, which provides detailed statistics on transit usage in 2025. Each year, these stats tell lots of fascinating little stories from across the region. As we did last year, we’re going to help you understand what they mean.
Executive Summary
- A drop in youth and student population in 2025 was one of the biggest stories in transit, causing significant drops in overcrowding and a slight drop in ridership systemwide.
- Despite this, several key routes in Surrey are far above their pre-COVID ridership, reflecting a permanent shift in the city’s commute patterns. Because of recent investments, Surrey is becoming a transit city.
- Routes with increased service saw major ridership increases, including in Tsawwassen First Nation and Pitt Meadows.
- Overcrowding still exists on many routes region-wide and must be addressed with additional buses. These new buses are needed most on routes in Surrey, east-west routes in Vancouver and Richmond, and routes crossing the Lions Gate bridge.
- Routes in Vancouver that saw major cuts during COVID have ridership that remains way below their 2019 peak. These routes illustrate the ridership death spiral phenomenon, and the main cure is more buses and more housing near transit.
- 39 routes have gotten over 10% slower since 2019. Slower buses cost TransLink over $115 million per year (note: a previous version of this release said the cost of slower buses was $25m – we regret the error!). We need to act quickly to get a handle on this runaway problem that’s harming transit in two ways: it’s driving away riders, and it’s inflating operating costs. Bus lanes and other forms of transit priority are the answer.
Overall ridership is down, but…
After years of rapid growth, ridership fell on average system-wide by 1.5%. TransLink says there are three reasons for a dip in ridership: slowing population growth, a decline in youth population, and economic uncertainty. Two years ago, Metro Vancouver was adding over 100,000 new residents each year. Last year, that number was only 5,300. This is because the federal government has cut international student and temporary worker arrivals, both demographics which rely heavily on transit.
| Transit Mode | 2024 Boardings *calculated based on 2025 boardings and rate of change | 2025 Boardings | Change | Percent of total boardings |
| Bus | 246,886,000 | 240,713,000 | -2.5% | 60.7% |
| Expo/Millennium Line | 106,974,000 | 104,196,000 | -2.6% | 26.3% |
| Canada Line | 42,122,000 | 42,594,000 | 1.1% | 10.7% |
| SeaBus | 5,399,000 | 5,606,000 | 3.8% | 1.4% |
| West Coast Express | 1,559,000 | 1,734,000 | 11.2% | 0.4% |
| HandyDART | 1,438,000 | 1,509,000 | 7.2% | 0.4% |
People ride transit more if you make it better!
Last year, TransLink funded a new investment plan that saw service increases for 37 routes. Routes which saw service improvements retained the most ridership. Frequency boosts for routes 719 and 722 resulted in a 57% jump in ridership. Route 609’s extension and service boost spiked ridership by 119%. Larger buses on the 23 resulted in a 4% ridership bump. Generally, if you look at the list of routes that have ridership increases, and the routes with service increases, it’s mostly the same list. This indicates that there is plenty of unmet transit demand out there.
Routes with notable service & ridership increases in 2025
| Route | 2025 ridership increase | Rank (of 194) | Where does it serve? | Why did it grow? |
| 609 | 119% | 1 | Tsawwassen First Nation | Route extended to Ladner Exchange and made more frequent |
| 719/722 | 57% | 2 | Pitt Meadows & Katzie First Nation | Higher frequency and Sunday service introduced |
| 743 | 23% | 4 | West Maple Ridge | Sunday service introduced |
| 31 | 13% | 9 | River District to Metrotown | Service added to address overcrowding |
Major routes with ridership increases over pre-COVID levels
These are the routes with over one million boardings in 2025 that have the highest percentage ridership increase over 2019 levels. Excluded are routes that have seen ridership increases because service was shifted from one route to another on the same corridor (ex: 41 and R4, 502 and 503).
| Rank | Route | 2019-2025 change in ridership | Where does this route go? |
| 1 | 323 | 37.9% | Surrey: 128 St |
| 2 | 640 | 27.7% | Surrey/Delta: River Rd |
| 3 | 364 | 26.2% | Surrey/Langley: 64 Ave |
| 4 | 335 | 21.6% | Surrey: Whalley, Guildford, Fleetwood, Newton |
| 5 | 321 | 20.9% | Surrey: King George Blvd |
| 6 | 345 | 19.8% | Surrey: 152nd St Express |
| 7 | 342 | 14.6% | Surrey/Langley: 56 Ave |
| 8 | 501 | 13.0% | Langley: 200 St |
| 9 | 301 | 11.4% | Surrey/Delta: Newton Express to Canada Line |
| 10 | 430 | 10.7% | Richmond/Vancouver: Brighouse to Metrotown |
The table above summarizes the dramatic transit transformation that’s taken place in Surrey. Similar to Brampton, Ontario, this suburban community that many assumed would remain car-oriented forever has seen a generational increase in transit ridership. This is evidence of a positive feedback loop at work. Ridership in Surrey remained strong through 2020’s pandemic due to a high density of essential workers. TransLink boosted capacity, initially to ensure social distancing, and later to address the overwhelming demand for transit. More buses meant lower wait times, and this spurred even more demand.
Even as population growth levels off, these Surrey routes remain completely transformed compared to 2019. The only non-Surrey route on the list is the R4, which made it on simply because of a massive re-allocation of service. In 2019, it was known as the 43, an express route which at the time only offered 32% of the service on this corridor, compared to the local 41 route, the primary route at the time. The following year, the 43 was upgraded to the R4 RapidBus, and buses were reallocated to the extent that it now makes up 71% of the corridor’s buses.
People ride transit less if you make it worse…
Many of Vancouver’s trolleybus routes, including the 3, 8, 10, 17 and especially the 20, have been in a continuing “death spiral”. Service was cut dramatically on these routes in 2020 in response to a drop in ridership. But these cuts in turn cause ridership to fall even further, which causes more service cuts, which causes ridership to fall, and so on. These routes are also consistently among the slowest in the entire system. Bus lanes on the busy roads they run on would make them cheaper to run and more convenient for riders, helping to stop the death spiral.
As you can see from the table below, the routes that have the biggest cuts in service are the same routes that have the biggest drop in boardings.
10 routes with the biggest drop in ridership, 2019-2025
| Rank | Route | Drop in boardings rank (of 194) | Change in boardings | Change in service level (revenue hours) | Where does this route go? |
| 1 | 20 | 3 | -54% | -33% | Vancouver: Victoria Dr, Commercial Dr, Hastings St |
| 2 | 8 | 4 | -54% | -33% | Vancouver: Fraser St |
| 3 | 3 | 5 | -52% | -32% | Vancouver: Main St |
| 4 | 14 | 6 | -45% | -10% | Vancouver: Hastings St, Granville St, Broadway |
| 5 | R5 | 7 | -45% | -24% | Vancouver/Burnaby: Hastings St |
| 6 | 9 | 8 | -44% | -31% | Vancouver: Broadway local |
| 7 | 10 | 9 | -43% | -27% | Vancouver: Granville St |
| 8 | 119 | 11 | -43% | -18% | Burnaby: Kingsway |
| 9 | 99 | 13 | -40% | -6% | Vancouver: Broadway express |
| 10 | 250 | 15 | -38% | 11% | West Vancouver: Marine Dr |
Routes were excluded from this list if their drop in ridership was due to an improvement in service on the same corridor. For example, the 41 had the biggest drop in ridership, but that was because the R4 RapidBus was introduced on the same street in 2020.
Zooming in on route 20
The 20, which serves Victoria Dr, Commercial Dr, and Hastings St, was our region’s 3rd busiest bus route in 2019. Since then, it has seen a 54% drop in ridership, and is now ranked 15th. We can propose a few explanations as to why:
- Much longer wait times: In 2019, a person trying to catch the 20 at Commercial @ 1st at noon would wait for up to 8 minutes. Today, that bus comes every 13-16 minutes.
- Poor reliability: The 20 has the same rate of on-time performance — 73% — as it did in 2019, which is far from acceptable. Riders will be familiar with waiting 30 minutes for a bus and then seeing three come in a row, a phenomenon called “bus bunching”. Vancouver has been rolling out bus priority measures to improve speed and reliability (bus lanes, queue jumps, etc) on other streets in the city, but has not yet made any significant changes to the roads the 20 runs on (Commercial, Victoria, and Hastings). Our 20-year old trolleybuses also have trouble passing through junctions, with “de-wiring” being an all-too-common occurrence, making service slower than it needs to be.
- Competing routes have improved: The trip from south Vancouver to the Expo Line along Victoria Dr can be slow on a bus, and with the longer wait time, riders have sought alternatives. The east-west crosstown routes on King Edward, 41st, 49th, and Marine have become better options as their frequencies have improved. If you’re standing at the corner of 49th and Victoria and you want to travel downtown, Google Maps will sometimes send you in the wrong direction, to Metrotown, on the 49 or 430, because they are that much better than the 20 at this point. But of course, those routes are crowded and need relief, as does the Expo Line.
- Micromobility is getting better: In the part of East Vancouver served by the 20, cycling offers travel times that are very competitive with the bus. The City of Vancouver has been investing in making those trips safer by building out the bike network, and the advent of e-bikes and scooters has made micromobility more useful for a lot of trips. Whether it be driving, cycling, or transit, infrastructure is what makes the difference.
- Lack of affordable housing: Most of the housing available along this corridor is single-family homes, which is by far the most expensive housing type in Vancouver. While historically, a home in East Vancouver may have been an affordable option, today a home is far out of reach, even for the middle class. A monthly mortgage bill for the median East Vancouver house is in excess of $8000/month.
How do we bring riders back to the 20, and all the other routes (8, 3, 10, 14, R5, etc.) in the same situation?
- Restore 2019 frequency levels (Who? Mayors’ Council and province) TransLink’s most recent Investment Plan has funds to increase frequency on these routes to a minimum of 12 minutes. We would like to see the mayors and the province increase funding in the next investment plan to get this frequency back to 8 minutes, like it was in 2019.
- Redesign streets to boost speed and reliability (Who? City of Vancouver) Council set an ambitious goal to deliver 10% speed improvements on 9 corridors by 2026. They have made some progress, but have not met this goal. In the next council term, we want to see aggressive progress towards installing bus lanes, queue jumps, signal priority, and improved bus stop spacing. These measures also save operating dollars, which can fund the frequency increases mentioned above.
- End trolley-related delays (Who? TransLink) Trolleybuses accidentally disconnect from their wires far too often. On shared corridors like Hastings, trolleys also get stuck behind other routes, because they can’t pass each other. The new generation of Solaris trolleybuses have a battery that allows them to run off-wire for 20km. This battery can be used in delay-prone sections to eliminate the delays that trolleywires cause.
- Introduce all-door boarding systemwide (Who? TransLink) Riders are allowed to board at all doors on RapidBuses, the 99 B-Line, and on the 143/145 at certain stops. This is permitted in order to speed up the boarding process. But why restrict all-door boarding to only these routes? San Francisco, Seattle, and soon New York will allow all-door boarding systemwide. Movement estimates that this policy would save $15 million/year here in Vancouver.
- End the apartment ban in Vancouver (Who? City of Vancouver) We are in a desperate shortage of affordable housing, and building new apartments in central neighbourhoods will not only bring down prices, but also give people far better access to public transit. Maintaining the current single-family home zoning will continue to exclude people from our city and force them into car-oriented sprawl neighbourhoods in Langley and beyond.
Overcrowding still remains an issue
We think there are two key reasons for this year’s big drop in overcrowding:
- TransLink’s 2025 Investment Plan raised new funding to add capacity that would target the most overcrowded routes.
- Students often experience the worst overcrowding, and there are fewer international students due to changes in student visa policy.
But—this doesn’t mean overcrowding is no longer a problem to be solved. In Surrey/Langley and Vancouver, the busiest routes are overcrowded on average one fifth of the time.
Overcrowding is not just experienced by students packed into buses to UBC. Below is a map of the most overcrowded routes in the system. Buses to the North Shore, Richmond, and many routes in Surrey still face bad overcrowding.
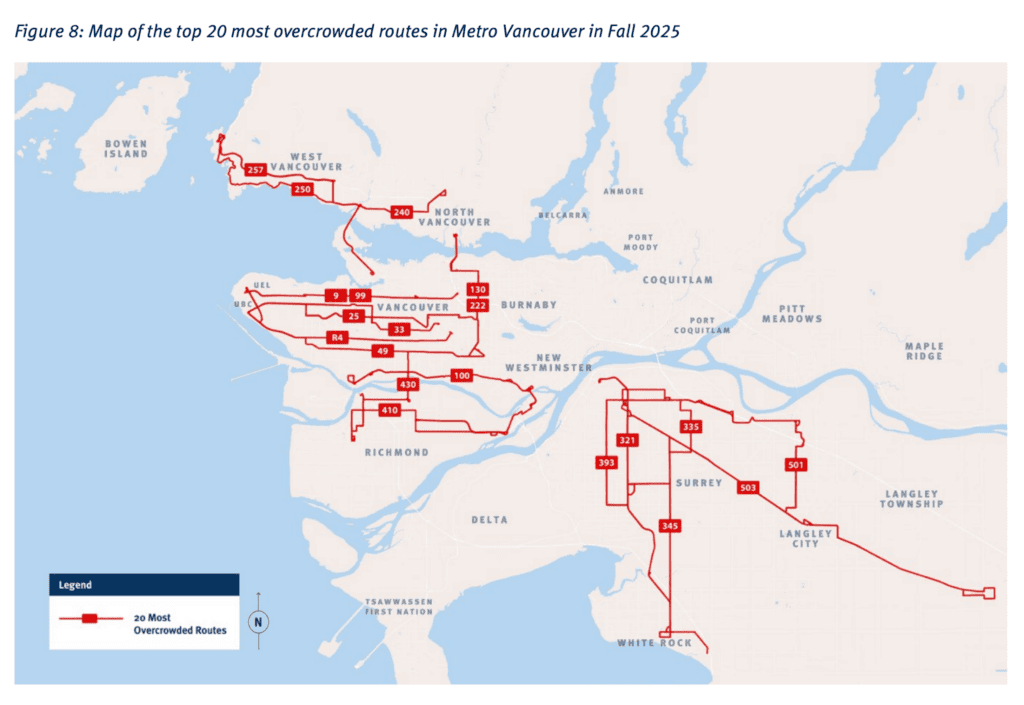
10 Most Overcrowded routes in 2025
| Rank | Route | % of trips with overcrowding | 2024-2025 Change | Where does this route go? | |
| 2024 | 2025 | ||||
| 1 | 99 | 20.4% | 20.3% | -0.2% | Vancouver: Broadway |
| 2 | 335 | 32.1% | 16.7% | -15.5% | Surrey: Whalley, Guildford, Fleetwood, Newton |
| 3 | R4 | 16.4% | 15.2% | -1.2% | Vancouver: 41st Ave |
| 4 | 49 | 18.9% | 14.3% | -4.6% | Vancouver: 49th Ave |
| 5 | 501 | 20.6% | 13.5% | -7.1% | Langley: 200th St |
| 6 | 321 | 33.0% | 12.6% | -20.4% | Surrey: King George Blvd |
| 7 | 345 | 28.1% | 10.8% | -17.3% | Surrey: 152nd St Express |
| 8 | 620 | 10.8% | 10.8% | 0.0% | Delta: Tsawwassen Ferry Terminal |
| 9 | 33 | 14.9% | 10.7% | -4.2% | Vancouver: 33rd Ave and 16th Ave |
| 10 | 240 | 7.1% | 10.5% | 3.4% | North Van: Lions Gate to Lynn Valley |
Top 5 routes with the greatest increase in overcrowding in 2025
| Rank | Route | % of trips with overcrowding | 2024-2025 Change | Where does this route go? | |
| 2024 | 2025 | ||||
| 1 | 241 | 1.4% | 6.6% | 5.2% | North Van: Express from Downtown to Upper Lonsdale |
| 2 | 257 | 4.3% | 9.0% | 4.6% | West Van: Horseshoe Bay Express |
| 3 | 240 | 7.1% | 10.5% | 3.4% | North Van: Lions Gate to Lynn Valley |
| 4 | 555 | 5.6% | 7.9% | 2.3% | Langley: Port Mann Express |
| 5 | 418 | 3.6% | 5.6% | 2.0% | Richmond: Kingswood Industrial to Expo Line |
Why do North Shore routes dominate this list? We are genuinely stumped. Perhaps as office workers return to in-person work, these buses towards downtown are filling back up. The 257 could be serving those who have moved to communities within ferry distance: Bowen Island, the Sunshine Coast, and Nanaimo.
Riders of the 23 along Beach Ave in the West End and Yaletown may have noticed a major change that wasn’t captured in the crowding metrics. The 23 was previously operated with a 24-passenger community shuttle, which would often leave passengers behind because it was full. These passups aren’t reflected in the TSPR metrics, but were a major irritant for many in the community. Finally, in April 2025, TransLink swapped those 24-person buses for 75-passenger standard buses. Annual ridership went up 4% as bus service hours dropped by 19%. 23 riders are now far less likely to get left behind by a full bus, although they are running at slightly lower frequencies than they were before.
Bus speed and reliability continues to be a problem
In the last two years, 19 routes got faster. 183 routes got slower. 7 routes, including the construction-beleaguered 502, had their average speed drop by over 10%.
Extend the comparison to 2019 and the results get dramatically worse. 39 routes have gotten over 10% slower since 2019. The vast majority of these slower routes are in Surrey, reflecting a major increase in congestion in that city.
Transit riders need solutions like transit priority to their commutes getting slower every year. Vancouver’s efforts to mitigate the impact of construction on Broadway’s bus speeds set the benchmark for how it should be done. While the rollout of bus lanes has been too slow across the region, we wanted to give kudos to the City of Vancouver for the proposal for bus lanes on 49th Avenue! After 3 years of Movement pushing for these lanes, they will make a real difference for transit riders and we hope to see projects like this continue to be proposed around Metro Vancouver.
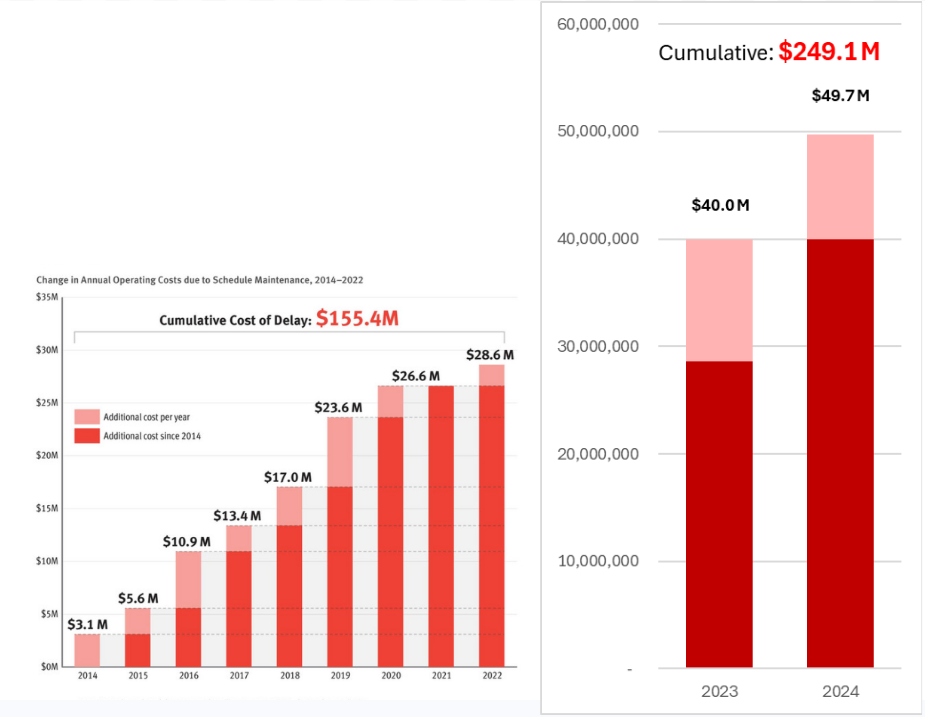
Slower buses have a real cost to riders. We estimate that TransLink has spent a quarter-billion dollars since 2014 on avoidable delays to bus service, and that number keeps growing at a faster rate every year. These are all taxpayer resources that could be used to make transit more frequent, but instead it’s being used to essentially plug a leak.
Below you can see TransLink’s initial estimate of the cost inflation from added delay between 2014 and 2022. We used data requested from TransLink to add data in 2023 and 2024; years that tower over all others.
The R4 RapidBus saw the biggest cost escalation in 2025, without significant changes in service frequency or span. That route required an additional 9,400 bus service hours in 2025, and at an estimated cost of $150 per service hour, that congestion cost an additional $1.4 million this year alone. This resulted in a 5.3% drop in scheduled speed this year, the largest of any RapidBus. The R4 is a route that already has some transit priority measures, but there remain major gaps.
Potential transit priority measures to get the R4 moving again
- Bus lanes on 41st Avenue between Victoria and Kingsway
- Active transit signal priority to give buses more green lights and less reds
- A bus lane and a transit-priority signal to address heavy congestion through and west of Kerrisdale
10 slowest bus routes in 2025
| Rank | Route | 2025 speed (km/h) | Where does this route go? |
| 1 | 5/6 | 9.9 | Vancouver: Robson St, Davie St, Denman St |
| 2 | 3 | 13.7 | Vancouver: Main St |
| 3 | 20 | 14.0 | Vancouver: Victoria Dr, Commercial Dr |
| 4 | 19 | 14.1 | Vancouver: Kingsway |
| 5 | 106 | 14.3 | New Westminster: 6th St |
| 6 | 8 | 14.3 | Vancouver: Fraser St |
| 7 | 15/50 | 15.1 | Vancouver: Cambie St and Granville Island |
| 8 | 230 | 15.3 | North Van: Lonsdale Ave |
| 9 | 229 | 15.4 | North Van: Lonsdale Ave |
| 10 | 16 | 15.4 | Vancouver: Renfrew, Hastings, Arbutus |
10 fastest bus routes in 2025
The fastest bus route, the 555, travels exclusively in High Occupancy Lanes on Highway 1. It’s twice as fast as the Canada Line (32 km/h) and significantly faster than the West Coast Express (55 km/h). It’s proof that priority lanes on freeways can be an incredibly cost-effective way of providing regional service that competes with driving.
But—the 555 has gotten 2.3% slower this year. How is that possible in exclusive lanes? On Highway 1, the 555 shares a lane with vehicles that have more than 2 passengers, as well as electric vehicles. The province let EVs use these lanes as a way of incentivizing people to buy them, but it looks like that policy may be past its best-before date. About 20% of all cars sold in BC are electric, meaning the speed benefit of those lanes is getting diluted fast. We think it’s time to end this policy of letting EVs in priority lanes in BC, and to ensure buses stay reliable, only allow high-occupancy vehicles if they have three passengers or more, like they do in California, Virginia, etc.
| Rank | Route | 2025 speed (km/h) | Where does this route go? |
| 1 | 555 | 64.7 | Langley: Port Mann Express |
| 2 | 262 | 47.9 | Lions Bay: Shuttle to Horseshoe Bay |
| 3 | 352 | 47.3 | Surrey: Ocean Park to Canada Line |
| 4 | 351 | 47.2 | Surrey: Semiahmoo to Canada Line |
| 5 | 620 | 46.3 | Delta: Tsawwassen Ferry |
| 6 | 311 | 42.6 | Surrey/Delta: Scottsdale express to Canada Line |
| 7 | 602 | 39.6 | Delta: Tsawwassen Heights to Canada Line |
| 8 | 749 | 39.5 | Maple Ridge: Ruskin |
| 9 | 354 | 38.9 | Surrey: Morgan Crossing to Canada Line |
| 10 | 748 | 35.8 | Maple Ridge: Thornhill |
10 routes with the highest one-year drop in speed (km/h)
| Rank | Route | 2024 speed | 2025 speed | 2024-2025 change | Where does this route go? |
| 1 | 250 | 23.8 | 22.0 | -7.7% | West Van: Marine Drive to Downtown Van |
| 2 | 145 | 29.6 | 27.3 | -7.7% | Burnaby: SFU express to Millennium Line |
| 3 | 251 | 26.8 | 24.8 | -7.6% | West Van: Queens Ave community shuttle |
| 4 | 502 | 24.3 | 22.5 | -7.5% | Surrey: Fraser Highway |
| 5 | 414 | 17.6 | 16.4 | -7.1% | Richmond: Kingswood Industrial to Expo Line |
| 6 | 311 | 45.8 | 42.6 | -6.9% | Surrey/Delta: Scottsdale express to Canada Line |
| 7 | 395 | 25.9 | 24.2 | -6.6% | Langley/Surrey: 64 Ave to Expo Line |
| 8 | 354 | 41.6 | 38.9 | -6.5% | Surrey: Morgan Crossing to Canada Line |
| 9 | 407 | 24.3 | 22.7 | -6.3% | Richmond: Gilbert Rd and Bridgeport Rd |
| 10 | 186 | 23.3 | 21.9 | -6.1% | Coquitlam: Pinetree Way |
The 250 saw our biggest drop in speed, losing nearly 8% in a single year, after maintaining roughly the same speed since 2019. We suspect this is due to a big, costly adjustment to the schedule to boost reliability. The 250 is a perfect illustration of how costly it is to keep stretching out runtimes instead of fighting congestion with transit priority. Although there are a variety of transit priority measures along the 250’s route, there are still plenty more opportunities to get that bus moving faster.
Potential transit priority measures to get the 250 moving again
- Automated bus lane enforcement to ticket drivers illegally using the bus lane
- Lane barriers on Marine Drive between Taylor Way and the Lions Gate Bridge which prevents bridge-bound cars from blocking the through lane
- On Georgia St, signal priority which lets buses bypass right-turning traffic and get to the stop line first.
- Signal timing tweaks to move traffic congestion to segments where buses can bypass it.
A few of these routes are being heavily affected by Surrey-Langley SkyTrain construction—notably the 502 and 395. Surrey and the SLS project team can allocate more resources to transit priority on Fraser Highway. Queue jumps and signal priority would make a significant difference at a low cost. Their colleagues working on the Broadway Subway bus diversion are demonstrating how effective they can be.
Top 10 routes by total added riders from 2024 to 2025
| Rank | Route | 2024 | 2025 | Percentage increase | Absolute increase | Where does this route go? |
| 1 | 9 | 3,993,678 | 4,169,619 | 4.4% | 175,941 | Vancouver: Broadway local |
| 2 | 257 | 1,326,466 | 1,457,848 | 9.9% | 131,381 | West Van: Horseshoe Bay Express |
| 3 | 555 | 1,181,696 | 1,282,978 | 8.6% | 101,283 | Langley: Port Mann Express |
| 4 | 19 | 4,378,439 | 4,463,307 | 1.9% | 84,868 | Vancouver: Kingsway |
| 5 | 49 | 8,499,489 | 8,582,084 | 1.0% | 82,595 | Vancouver: 49th Ave |
| 6 | 23 | 1,522,842 | 1,588,820 | 4.3% | 65,978 | Vancouver: Beach Ave |
| 7 | 373 | 893,769 | 959,185 | 7.3% | 65,416 | Surrey: Bolivar Heights |
| 8 | 130 | 3,255,555 | 3,316,660 | 1.9% | 61,105 | Burnaby/North Van: Willingdon to Phibbs |
| 9 | 84 | 2,167,861 | 2,224,861 | 2.6% | 57,000 | Vancouver: West 4th Ave Express |
| 10 | 609 | 44,306 | 96,952 | 118.8% | 52,646 | Delta: Tsawwassen First Nation |
Many of the routes that gained riders this year are gradually working their way back up to pre-COVID levels. The 23 is notably well above its pre-COVID levels, likely thanks to the fleet change that took place in April 2025. The route is now operated with standard buses instead of community shuttles, meaning far fewer passengers are left behind by full buses.
The 373 in Bolivar Heights saw a big increase in ridership thanks to an increase in frequency and better early morning/late night service. It’s encouraging to see the 130 on this list, as in September it will be supplemented by the R2 RapidBus extension that will improve speed and frequency along Willingdon and through Burnaby Heights. We’ve been actively supporting the proposal for BRT along this same corridor, and we wrote a blog post to help understand the difference.
Some notable shakeups in the ranking of SkyTrain stations
The shifting ranking of SkyTrain stations by ridership tells an interesting story about our shifting regional transit demand. Since 2019, Scott Road jumped from 21st busiest to 12th busiest station in the region, likely in concert with the rising rankings of bus routes that feed that station. (The 640 jumped from 83rd to 61st, and the 319/R6 jumped from 7th to 4th.) Surrey Central also benefitted from an increase in Surrey bus ridership, propelling it up 7 places. Brentwood and Burquitlam jumped 7 places thanks to a major increase in the supply of apartments and retail services at those stations.
Meanwhile there was a three-way tie for biggest drop. Production Way-University station dropped six places, likely reflecting greater flexibility for SFU students to work and study from home. Aberdeen Station dropped 6 places, perhaps due to the new Capstan Station, which now offers a shorter walk for many of the people who previously used Aberdeen. Olympic Village Station also dropped six places, perhaps reflecting increasing rates of cycling and scooter use in that neighbourhood, as well as drops in ridership for the two routes that serve that station: 84 (-33% since 2019) and the 15/50 (-28%). Main Street-Science World and Broadway-City Hall dropped by five places, likely for similar reasons.