TransLink has released their annual Transit Service Performance Report (TSPR) for 2024, tracking a number of important stats on what kind of year our transit service had. We’ve summarized our comments in this press release, but read on for much more detail.
The numbers for this year are broadly in line with the numbers last year, and the busiest routes then are also the busiest routes now. Ridership is slightly up from last year overall, but the growth is very concentrated south of the Fraser – Surrey has seen a large proportional increase in bus ridership, while most other regions saw flat or declining ridership.
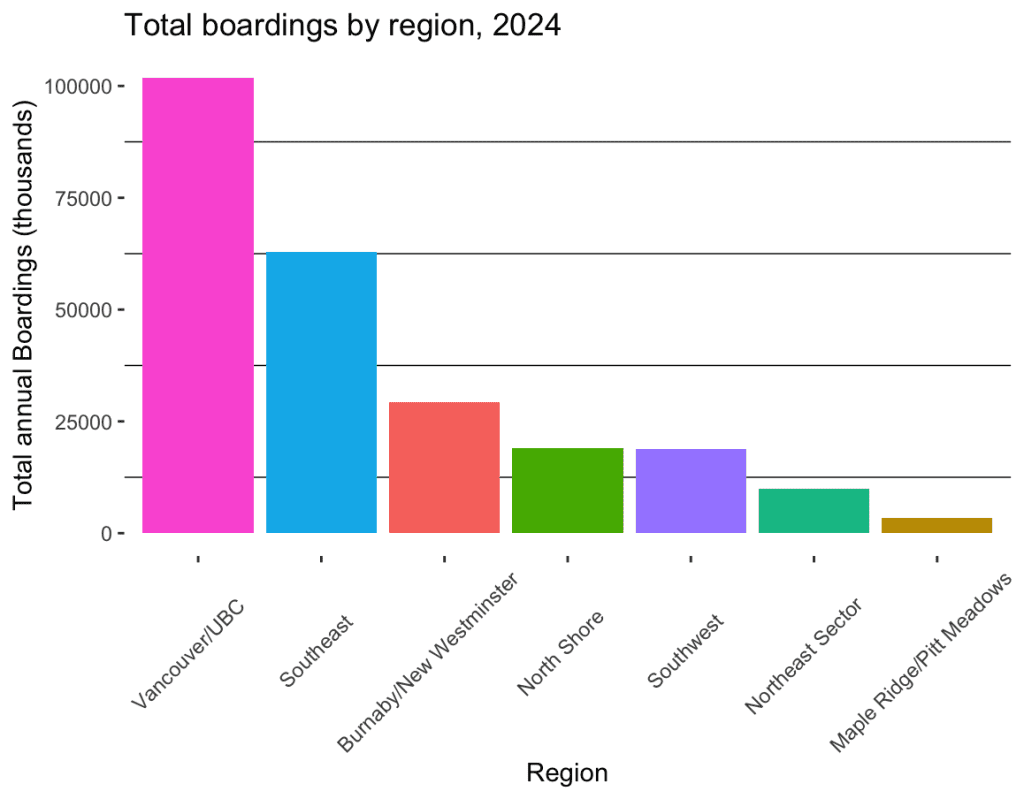
Vancouver saw a slight decrease in ridership, but it still accounts for a huge plurality of transit ridership-over 40% of all bus boardings took place on routes serving Vancouver and UBC, though this is a decline compared to the 47% that it was before the pandemic. The Southeast sector, which is mostly Surrey but also includes White Rock, Langley, and North Delta, meanwhile, saw 26% of total boardings in 2024, compared to 23% in 2023 and 18% in 2019-showing just how quickly those cities are growing both in terms of population and in their importance to our transit network. Still, the continued dominance of routes crossing Vancouver east to west and connecting to UBC shows how transformative the Broadway Subway Project and the long-awaited SkyTrain extension to UBC will be:
The Top 10 Busiest Bus Routes
| Rank | Route | Total Boardings (2024) |
| 1 | 99 B-Line | 10,623,737 |
| 2 | R4 RapidBus | 8,802,709 |
| 3 | 49 UBC/Metrotown Station | 8,499,489 |
| 4 | 25 UBC/Brentwood Station | 6,360,716 |
| 5 | 16 29th Ave Station/Arbutus | 5,316,227 |
| 6 | R6 RapidBus | 5,246,153 |
| 7 | R1 RapidBus | 5,163,382 |
| 8 | 323 Surrey Central/Newton Exchange | 4,881,294 |
| 9 | 19 Metrotown Station/Stanley Park | 4,378,439 |
| 10 | R5 RapidBus | 4,346,935 |
While ridership has increased from last year, recovery from the pandemic appears to have slowed and reached some kind of limit at roughly 90%, while service remains essentially unchanged. The Skytrain has seen more universal increases in ridership, but here too the biggest changes are in Surrey, with 3 of the 4 Skytrain stations in that city surpassing their 2019 numbers, with the only exception being King George, which saw extended closures. The busiest stations overall are the usual suspects like Waterfront, Metrotown, and Commercial-Broadway, but Surrey Central has now joined their ranks in the top five.
Top 10 Busiest Skytrain Stations
| Rank | Station | Annual Boardings (2024) |
| 1 | Waterfront | 10,470,597 |
| 2 | Metrotown | 8,513,043 |
| 3 | Commercial-Broadway | 6,757,027 |
| 4 | Granville | 6,149,464 |
| 5 | Surrey Central | 6,008,403 |
| 6 | Burrard | 6,003,131 |
| 7 | Joyce-Collingwood | 5,110,734 |
| 8 | Vancouver City Centre | 4,970,914 |
| 9 | Stadium-Chinatown | 4,928,968 |
| 10 | New Westminster | 4,561,485 |
While the introduction of articulated buses has gone a long way towards alleviating overcrowding on certain notoriously packed routes, such as 25 and 323, a lot of routes remain severely overcrowded, particularly south of the Fraser and in the most heavily-frequented routes in Vancouver. Some of the routes broke the mark of 30% or greater trips with overcrowding, an astonishing figure. The following table shows how rough the situation is, particularly in Surrey:
Top 10 Most Overcrowded Routes
| Rank | Route | % of trips with overcrowding (2024) |
| 192 | 393 Surrey Central/Newton Exchange | 34.65 |
| 191 | 321 Surrey Central/Newton Exchange | 32.99 |
| 190 | 335 Surrey Central/Newton Exchange | 32.14 |
| 189 | 345 King George Station/White Rock Centre | 28.13 |
| 188 | 503 Fraser Highway Express | 22.68 |
| 187 | 501 Langley Centre/Surrey Central | 20.62 |
| 186 | 99 B-Line | 20.42 |
| 185 | 49 UBC/Metrotown Station | 18.93 |
| 184 | 342 Newton Exchange/Langley Centre | 16.47 |
| 183 | R4 RapidBus | 16.39 |
The TSPR also contains info about the average speed of each bus route-another common source of bus rider misery is buses that travel very slowly. Maybe unsurprisingly, the slowest buses in our network are almost all concentrated in very heavily congested downtown Vancouver. These are still some of the most heavily used buses in the region, but many of them have seen pretty steep drops in ridership in recent years, likely as a result of these slow speeds as well as cuts and decreasing demand from office-bound commuters as working from home becomes more routine:
Top 10 Slowest Bus Routes
| Rank | Route | Average Speed (km/h) |
| 195 | 05/06 Robson/Downtown/ Davie | 9.84 |
| 194 | 3 Main/Waterfront Station | 13.80 |
| 193 | 20 Victoria/Downtown | 13.95 |
| 192 | 19 Metrotown Station/Stanley Park | 14.15 |
| 191 | 8 Fraser/Waterfront Station | 14.19 |
| 190 | 106 New Westminster/Edmonds Station | 14.48 |
| 189 | 23 Main St Station/English Bay | 15.22 |
| 188 | 15/50 Cambie/Waterfront Station | 15.36 |
| 187 | 230 Upper Lonsdale/Lonsdale Quay | 15.49 |
| 186 | 229 Lynn Valley/Lonsdale Quay | 15.52 |
The fastest routes tend to be the ones that can travel relatively uninterrupted along highways or other roads without a lot of stops, also not a very surprising result.
Top 10 Fastest Bus Routes
| Rank | Route | Average speed (km/h) |
| 1 | 555 Lougheed Station/Carvolth Exchange | 66.14 |
| 2 | 352 Bridgeport/White Rock Centre | 48.75 |
| 3 | 262 Caulfeild/Brunswick | 48.26 |
| 4 | 351 Bridgeport/White Rock Centre | 47.55 |
| 5 | 620 Tsawwassen Ferry/Bridgeport | 46.88 |
| 6 | 311 Scottsdale/Bridgeport | 45.76 |
| 7 | 354 Bridgeport/White Rock South | 41.58 |
| 8 | 602 Tsawwassen Heights/Bridgeport | 39.98 |
| 9 | 749 Haney Place/Ruskin | 39.94 |
| 10 | 748 Haney Place/Thornhill | 36.31 |
SeaBus, WCE, and HandyDART
The SeaBus saw nearly 6 million boardings last year, a slight increase from 2023. If it were a land bus route, it would be the 5th busiest, between the 25 and the 16, but it too remains at around 90% of pre-pandemic ridership.
The West Coast Express saw around 1.56 million boardings, which would make it the 51st busiest bus. It has almost doubled its ridership since the low days of 2022, but it still lags at about 60% of its 2019 ridership.
HandyDART, for its part, saw about 1.3 million boardings (62nd busiest bus) – essentially unchanged from last year, and only very slightly below 2019 levels. There was a 2% increase in service hours, which is a positive trend, although there was a 5% increase in registrants.
Other notable stats
Now it’s time to hand out a few awards, and a few anti-awards, for how things are trending from last year.
First up, the bad news. (Note: for the purposes of this list we’re sticking to routes with more than 100,000 yearly boardings, since smaller numbers tend to be more volatile.)
Biggest drop in ridership (percentage): 319 Scott Road Station/Newton, which is probably an artifact of how the new R6 on the same route has picked up a lot of people who would otherwise have gotten on a 319. If you sum the ridership of the R6 and 319, ridership is up 21%. If you exclude corridors with new routes, the peak-only 418 22nd St Station/Kingswood saw the biggest percentage drop at 13%. Next was the 2 MacDonald/Burrard Station on Vancouver’s West Side, which saw a 10% drop in ridership. This may have to do with the 8% reduction in frequency that came with its conversion to articulated buses. TransLink can save operating dollars by switching a route to higher-capacity articulated buses and reducing the frequency, but this can make it less attractive to riders by increasing wait times.
Biggest drop in ridership (absolute): 319 Scott Road Station/Newton “wins” again, with the same asterisk as before: The R6 was launched in January 2024, offering faster and more frequent service on the same corridor. More interesting is the 99 B-Line, which has the second biggest drop, losing 660,000 riders in 2024. Interestingly, the local 9 bus route on the same corridor gained 128,000 riders. As for the remaining 532,000 riders, it’s likely a combination of factors: telework, reduced international student visas, Subway construction, and the network effects from a significant reduction in frequency on 8 of the routes that the 99 connects to.
Third on the list is once again 2 MacDonald/Burrard Station, with a drop of 352,000 riders, likely due to a reduction in frequency.
Biggest increase in overcrowding: 116 Edmonds/Metrotown saw its fraction of trips with overcrowding go from 2% to 10%, the biggest increase in that figure this year. This route, serving Burnaby’s residential South Slope and the Big Bend industrial area, has seen significant changes in April 2025 to address this overcrowding. 501 Langley Centre/Surrey Central is less than a percentage point behind, from just over 12% to 20%, which reflects significant ridership growth, likely due to new development. Part of this corridor will be covered by the proposed Langley-Maple Ridge BRT. Perhaps most alarming is the 393 Newton Exchange/Surrey Central, which technically saw the 3rd biggest increase in share of trips with overcrowding but saw it rise from 27% to a very dire 34.6%. The 393 is a peak-only route on the fast-growing 128 St corridor in Surrey, and peak-only routes always rank very highly on this metric.
Biggest slowdown (percentage): All of the most heavily affected routes here are in Surrey, likely due to big jumps in ridership and traffic. Ridership slows transit because buses take longer to exchange passengers at stops. Worst place goes to 375 Guildford/White Rock Exchange, which travelled down 152 St 13% slower in 2024. The 391 Scott Road Station/Scottsdale on 116th and 324 Surrey Central/Newton Exchange on 132nd are close behind. Just barely missing the mark is the R1 RapidBus, which got about 10% less rapid this year compared to last.
Biggest slowdown (absolute): The top 4 are the same as above, but with the 324 being bumped down to 5th place in exchange for 595 Maple Meadows Station/Langley Centre which serves 208th. The unfortunate biggest loser here is still the 375, however.
It’s not all bad news though: while it can be fun to complain, we also need to celebrate the progress that we’ve made in certain places. To cleanse our palate a bit, here is the official Most Improved Buses of 2024:
Biggest gain in ridership (percentage): The 80 River District/Marine Drive Station tops this metric, probably because it is stimulating new ridership as well as the fact that it only existed for 8 months in the previous year. The next biggest are south of the Fraser, with every single other member of the top 10 serving or connecting to Surrey. The most immediate runners-up here are the 326 Guildford/Surrey Central Station which loops through Fleetwood (22% increase), and the 321 Surrey Central/White Rock Exchange which serves King George (21% increase). All of these routes have seen significant increases in transit service.
Biggest gain in ridership (absolute): This category is won by the 321, which saw over 765,000 more riders pass its doors in 2024 compared to 2023. Just a hair behind is the 323 Surrey Central/Newton Exchange (+755,000), and in a distant third is the 335 Surrey Central/Newton Exchange (+489,000). Once again, all but one of the top 10 in this category serve the Southeast sector, overwhelmingly in Surrey.
Biggest decrease in crowding: The upgrade from small buses to longer articulated buses has spared a lot of pain for the riders of the 25 UBC/Brentwood Station, the fourth-busiest route of them all, dropping from 27% of trips experiencing crowding to only 7%. Unfortunately, when TransLink increased the vehicle size, they also reduced frequency, which may have been the reason for a 6% drop in ridership. Conversely, on the 323, TransLink boosted frequency and capacity, and ridership grew by 18% while the percentage of crowded trips dropped from 29% to 12%. Rounding out the podium here is the 319, which as mentioned before saw a majority of its passengers move to the R6, giving a good deal more breathing room to those who remain.
Biggest speed-up (percentage): The 102/103 in New Westminster had approximately 11.5% more spring in its step last year, followed by the 407 Gilbert/Bridgeport in Richmond and the 80 in the River District. We have no explanations for any of these – if you can think of one, please drop us a line.
Biggest speed-up (absolute): The winners here are identical to those for the proportional tally: 102/103, followed by 407 and then 80.
What have we learned from all this?
While transit ridership is obviously influenced by outside factors like population growth, economic changes, or cultural changes like the widespread adoption of work-from-home, there is a lot that can be done through the service provided in order to make transit a more attractive option. After all, most people who get on a bus aren’t doing that because they love buses, they’re doing it because they think it’s the best choice to get them where they want to go. People can’t get on buses that aren’t there, and if there’s longer gaps between buses they may decide that it’s simply not worth the wait and find some other way to travel.
While frequency isn’t measured directly in the TSPR, we have a number of proxies we can use to figure out how often the bus is running. One of these is the number of “revenue hours” a bus route records over a year, which is to say the sum of all the hours each individual bus traveling along that route has spent either rolling or picking up passengers at a stop. The higher the number of revenue hours, the more buses are typically running on that route, which means higher frequencies. So how have revenue hours changed since 2019? Overall, not very much. When broken down by region, however, a clear pattern emerges:
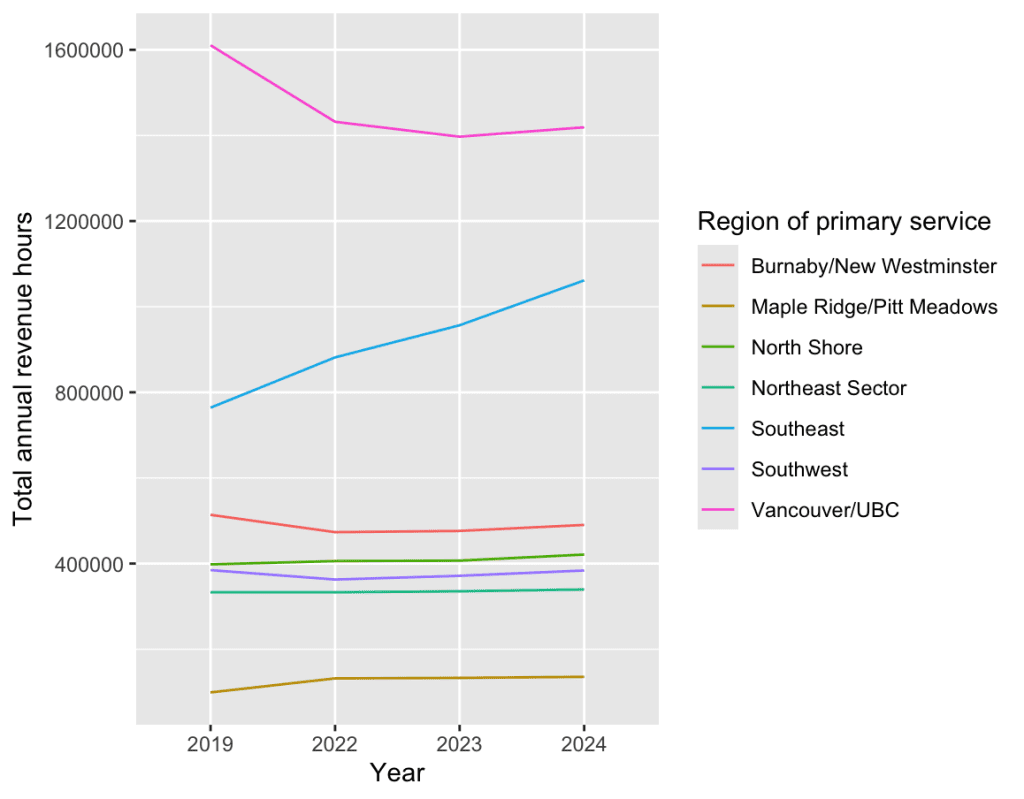
Service in Vancouver has been largely removed in order to feed the growing demand in Surrey and other South of Fraser cities. While it has started to return, service remains well below 2019 levels. The growth in Surrey’s population and ridership has also been matched by rapidly increasing attention being devoted to the Southeast.
Why does this matter? It’s a well-known fact that ridership and service create a positive feedback loop: high ridership creates high demand for investment in a given route, which makes it a more attractive option, which creates higher ridership. The same is true in reverse, where lower ridership leads to a “death spiral” of ever-worsening service. Indeed, this is exactly what we find here as well. The change is visible taking into account just the last year of changes, even if the data is pretty noisy:

Taking a longer view and showing how things have changed since before the pandemic, however, and the relationship becomes very clear:
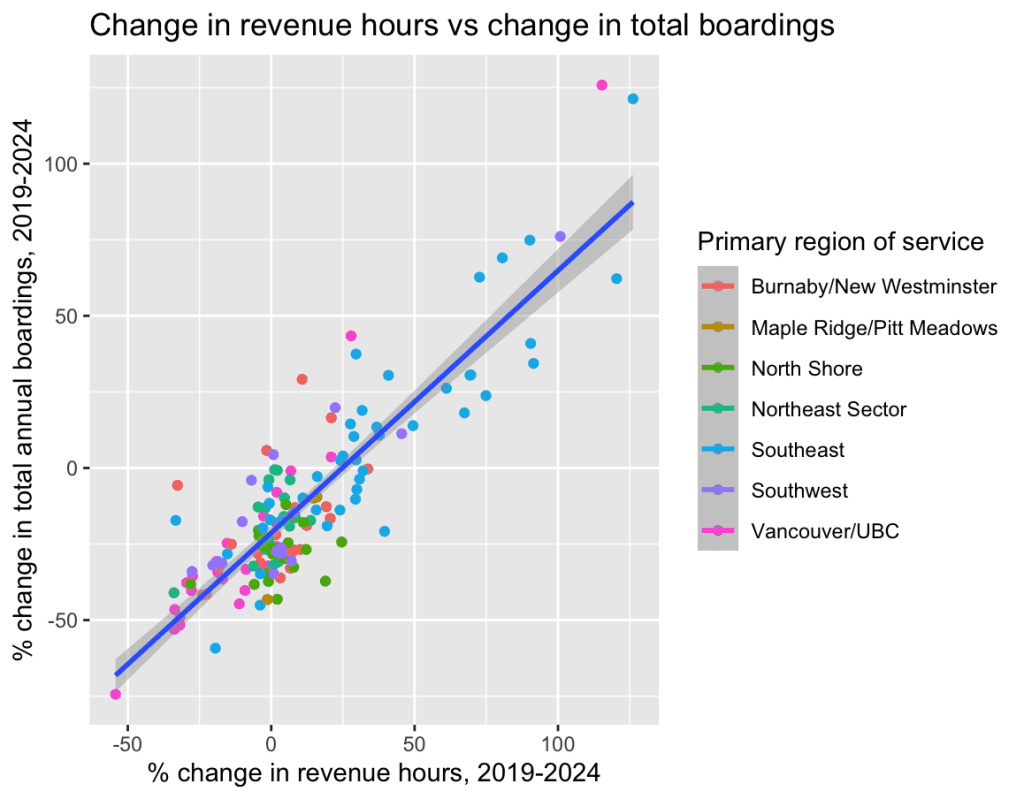
Now, before we jump to any massive conclusions here, we have to make the same disclaimer that you will hear in every stats class: correlation does not necessarily mean causation. It’s not easy to figure out which came first, the chicken of changes in ridership or the egg of changes in service levels, and it’ll take a bit of nuanced analysis to properly untangle this. That said, it’s very obvious that changes in service and changes in ridership are very tightly linked, and we do have direct control over one of these variables. Indeed, we have observed in cities around the world that one of the most reliable ways to boost transit ridership is to simply make existing service more frequent.
This will require investment by municipal and provincial governments, and some changes in TransLink’s approach. Operating a bus or a train costs money. Since 2020, the only way to address ridership growth has been to cannibalize service from somewhere else, We can clearly see the worst overcrowding remains in the fastest-growing areas in Surrey and Langley, and the biggest cuts have been taking place in high-ridership Vancouver, leaving everyone unhappy.
In order to do across-the-board improvements, there are two ways that we can go about doing this: we either add more service, or we find ways to get more out of the service we already have.
Adding more service
The first is a rather straightforward question of spending on funding for operations from the province and from municipalities, which is exactly what came perilously close to collapsing just a couple months ago. TransLink now has the money to increase bus service by 5%, and will start implementing this new service in September 2025. But if we want to restore frequency in the places it has been cut deeply, while continuing to address overcrowding in Surrey and Langley, 5% won’t do it. We will need to find a funding tool that allows for more growth, and that doesn’t expire in 2027 like the current provincial funding does.
Getting more out of the service we already have
The second is a bit more complicated and will require more buy-in. Every decision maker will have a role to play here. Municipal governments will need to invest bus priority infrastructure such as dedicated lanes or signal priority to speed up buses, allowing them to cover more ground in the same amount of time. Specifically, the routes running from north to south through Vancouver, particularly downtown and in East Vancouver, as well as much of Surrey, need some serious upgrades in order to reach their potential.
Bus priority measures can have tangible and immediate results, often saving enough money to cover their construction cost in a matter of months. This TSPR demonstrates how the City of North Van’s new Marine-Main upgrades on a small portion of the R2 RapidBus boosted that route’s overall speed by 2.5%. Previously, Vancouver’s efforts to speed up several routes generated enough savings to launch the new 80 bus route to the River Distric.
The provincial government has a role to play, by expanding transit infrastructure on provincially-run roadways under their control and to expedite construction of bigger-scale projects such as the Millennium Line extension to UBC or the proposed north-south route through Burnaby.
TransLink’s role is to change adopt the internationally-accepted practice of allowing boarding at all doors on all routes, which would confer the greatest benefits on the routes with the most riders and slowest speeds.
What is needed the most is the vision to dream big, and the will to execute on the goals that our leaders like to remind us of-for an easier way to get around conveniently, affordably, sustainably, and equitably. The ingredients are mostly here already, we just need to put it all together and truly put transit first.